


Turning Raw Rows into Actionable Revenue
The Cognitive Advantage of Visualization Data is only as valuable as the decisions it inspires. A spreadsheet containing 50,000 rows of transactional data is, for the human brain, effectively “noise.” Our minds are not evolved to parse long-form grids for patterns; however, they are highly optimized for spatial and colour-based recognition. This is the core of Visual Intelligence. The human brain processes visual information roughly 60,000 times faster than text or numbers. By translating those 50,000 rows into a dynamic heat map or a trend-line with standard deviation bands, you are essentially “hacking” the decision-making process to be faster and more accurate.
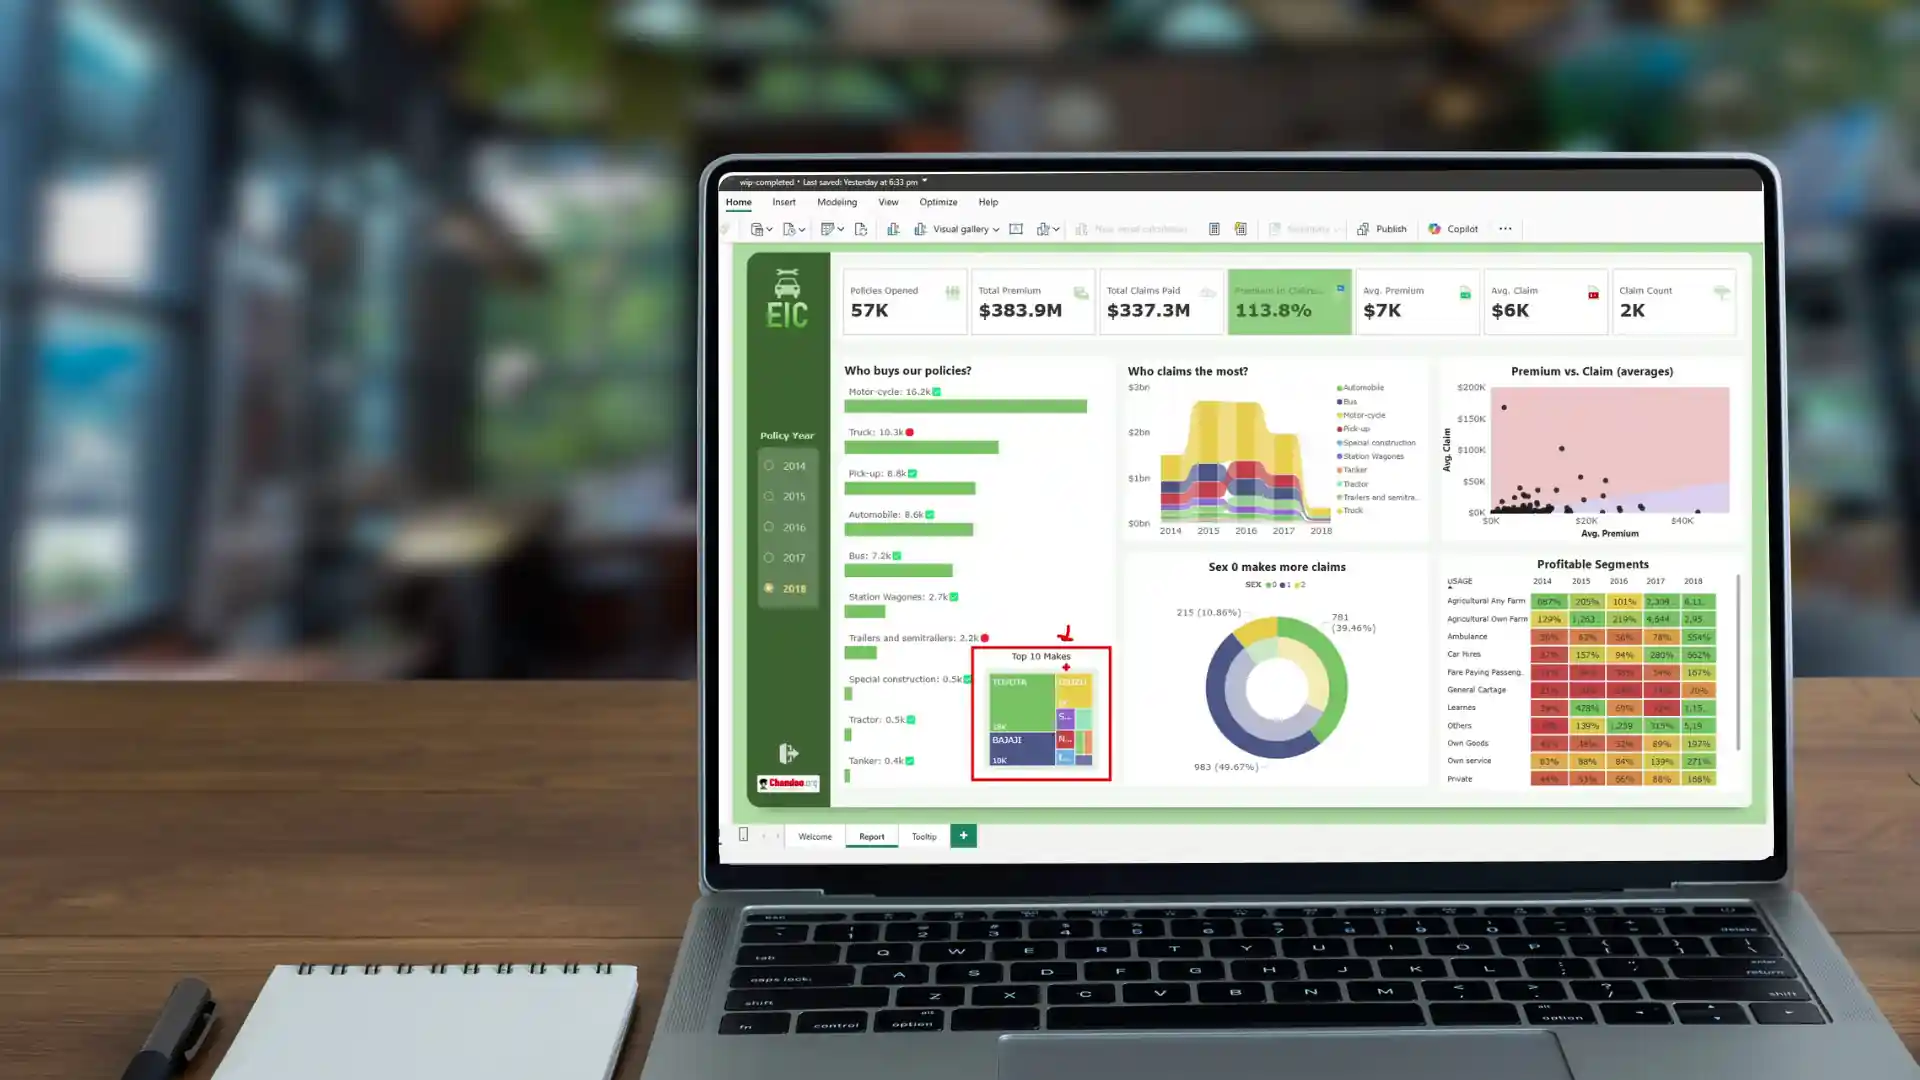
Turn raw data into actionable revenue. Explore the power of Visual Intelligence and learn how expert data analytics deployment transforms massive spreadsheets into intuitive BI dashboards that allow your team to spot trends 60,000x faster.
Democratizing Data Across the Enterprise One of the primary goals of data deployment and training is “Data Democratization.” In the old model, data was a gatekept resource. If a manager needed a report, they had to put in a ticket with the IT department or a specialized data scientist. This creates a lag that kills momentum. Modern BI tools like Power BI, Tableau, or Looker allow stakeholders at every level from the intern in marketing to the CEO in the boardroom to interact with data without needing a PhD in Statistics. Strategic deployment ensures that the right person has the right insight at the exact moment they need to make a move.
From Descriptive to Predictive Moving beyond the “grid” allows a firm to progress through the stages of data maturity. Most Excel-based firms are stuck in “Descriptive Analytics” (what happened?). Visual Intelligence and robust deployment allow you to move into “Diagnostic Analytics” (why did it happen?) and eventually “Predictive Analytics” (what is likely to happen next?). When you can see a 15% drop in regional performance visualized against historical seasonality, it stops being a mystery and becomes a call to action. We don’t just provide the software; we provide the training to ensure your team knows how to read the story your data is trying to tell.